There's a pattern that shows up in markets again and again: a stock slides for a few weeks, the mood around it turns sour, and then — quietly, without announcement — it drifts back toward where it started. Traders have a name for this tendency. They call it mean reversion, and it's been studied, debated, and traded for longer than most modern financial instruments have existed.
The question isn't whether the idea is interesting. It's whether it actually holds up when you run it against real data — and which kinds of stocks it works on best. With Porfie, that question has a straightforward answer: describe both the portfolio and the strategy in plain language, and the backtest builds itself. RSI threshold, trend filter, minimum hold time — say it the way you'd say it out loud, and Porfie reads each clause. Think of it as vibe quant — turning a market intuition into a result you can actually look at.
What is mean reversion?
Imagine stretching a rubber band. The further it's pulled from its resting position, the stronger it wants to snap back. Mean reversion treats stock prices similarly: when a price strays far from its recent average behaviour, there's a tendency — not a certainty, but a tendency — for it to drift back.
The classic signal is the RSI (Relative Strength Index). It measures how aggressively a stock has been sold off relative to its own recent price swings, on a scale from 0 to 100. An RSI below 30 is generally considered "oversold" — the rubber band is stretched. A mean-reversion strategy buys at this point and waits for the snap-back.
A 10% drop means something very different for a volatile tech stock versus a steady utility. RSI normalises the move relative to that stock's own typical swings, so the signal fires at a meaningfully oversold level for each stock — not just any stock that happened to fall on a bad week.
Mean reversion tends to show up most reliably in stable, well-established companies: utilities, consumer staples, large healthcare names. Their earnings don't change much quarter to quarter, so when their price dips sharply, it's more likely the market overreacting than the business deteriorating. On more volatile, cyclical stocks, the same signal works differently — sometimes better, often bumpier. That's exactly what we'll test by comparing two different portfolios below.
How Porfie splits strategy building into two steps
Porfie handles strategy building in two separate prompts — a useful distinction that mirrors how quantitative strategies actually work:
The backtest runs against the saved portfolio, so the order matters: build the portfolio first, save it, then apply the strategy and run. Let's do exactly that.
Step 1 — Build and save a portfolio
For mean reversion to work, the choice of stocks matters enormously. We'll build two different portfolios from company fundamentals and test the same strategy on each — the comparison reveals more than either result alone.
Portfolio A — "Steady Payers"
Every condition here serves the same purpose: find companies whose fundamentals change very slowly. Three years of positive net income rules out businesses losing money. The $8B revenue floor keeps the focus on large, established names in slow-moving sectors. The revenue ranking puts the most dominant businesses first.
Porfie's portfolio builder is a ranked shortlist, not a hard filter — occasionally a company with incomplete data or an edge case slips through. Before confirming, glance at the net income column and deselect anything showing a loss or a sector that clearly doesn't fit. It takes 30 seconds and keeps the portfolio honest.
In backtests, when Portfolio A's RSI dips below 30 AND the stock is still trading above its 200-day moving average, it has historically corresponded to a short-term sell-off inside a longer uptrend — a clean mean-reversion setup. That's the combination the strategy is set up to detect.
Portfolio B — "Value Dippers"
Portfolio B selects companies that are fundamentally sound — real revenue, mostly profitable — but more sensitive to economic cycles. Industrials and financials swing harder with the macro. The $5B revenue floor still filters out smaller companies, but this universe carries more inherent volatility. An RSI dip here might be a short-term overreaction, or it might reflect something the market is genuinely repricing. In the backtest data, the same signals produce a different character on this universe: larger swings in both directions.
The screener ranks by revenue, so glance at the generated list before saving — the top results should be names you recognise from the sector.
Running the same strategy on both portfolios answers a question the strategy alone can't: how much roughness are you willing to tolerate for potentially higher returns? Portfolio A is the calmer version. Portfolio B is the more dramatic one. Seeing both side by side is more instructive than either alone.
Step 2 — Add the strategy and run the backtest
With a portfolio saved, the trading rule is the same for both. The strategy below is mean reversion with two guardrails — a trend filter to avoid "falling knife" entries, and a minimum hold time to prevent same-week round trips on noise. Paste it into Porfie's strategy / vibe field:
What each clause is doing:
- 21-day RSI < 30 → entry signal. Slightly longer window and a tighter threshold than the textbook 14/30 — fewer trigger events, but each one represents a deeper, more confirmed pullback. Porfie opens a simulated position on the bar where this fires.
- Price above 200-day moving average → entry filter. This is the "don't buy a falling knife" guardrail. An RSI dip in a long-term uptrend often does mean-revert; an RSI dip mid-downtrend often keeps falling. The filter blocks entries on the second case. In the backtest the framework AND-s this filter with the RSI signal: both must hold on the entry bar.
- Minimum 5-day hold. Without this, an RSI snap-back the day after entry would close the position immediately — noise rather than mean reversion. Porfie tracks each position's age and refuses exits until the position is at least 5 trading days old.
- RSI > 65 → exit signal. Price has recovered to a slightly more decisive zone than the usual 55. Once the minimum hold has elapsed, the first RSI > 65 bar closes the position.
Each clause maps to a configuration on Porfie's signal-driven basket engine: indicator + period, entry threshold, AND-filter condition, minimum hold days, exit threshold. Nothing else is implicit — the strategy you describe is the strategy that runs.
Run it on Portfolio A first. Note the results. Then switch to Portfolio B with the same strategy and the same time window (a 5–10 year window is ideal — long enough to include at least one meaningful market downturn).
What the comparison shows
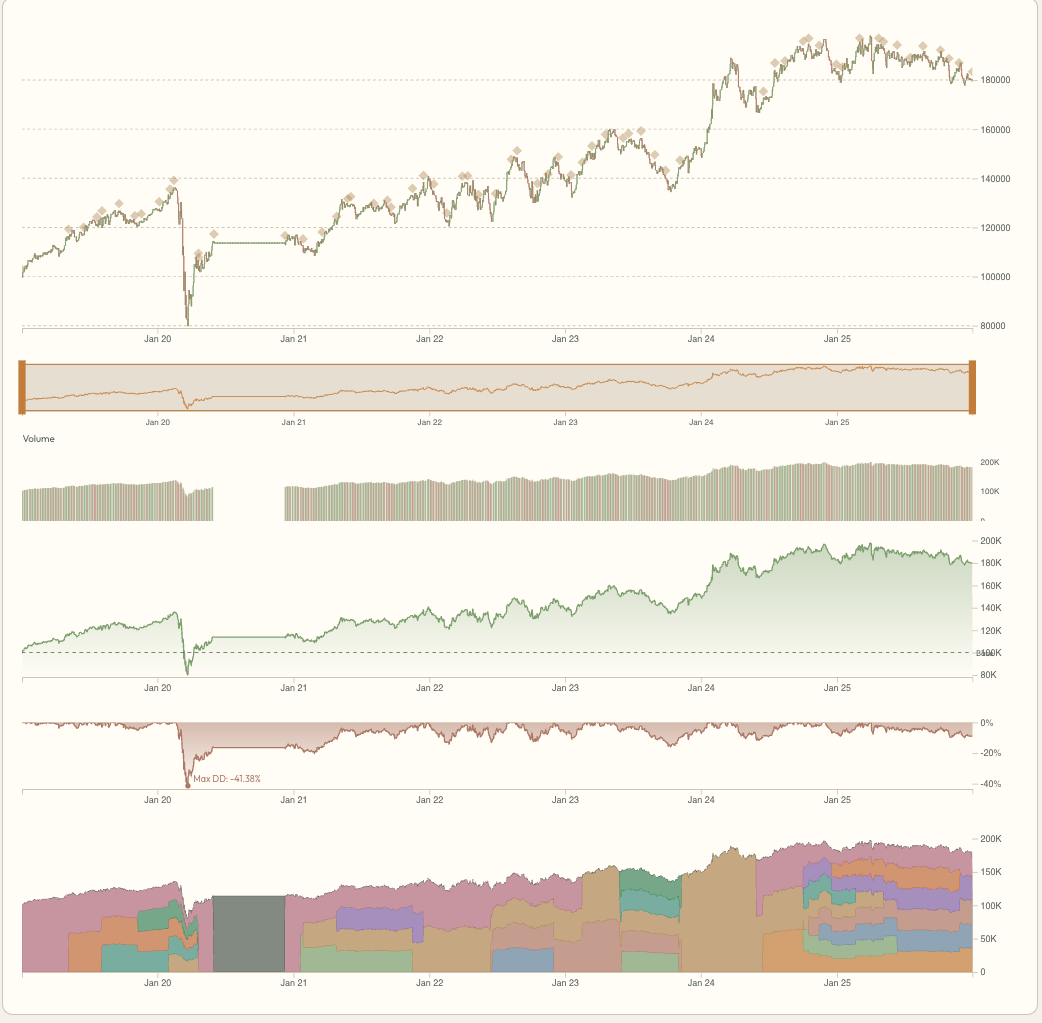
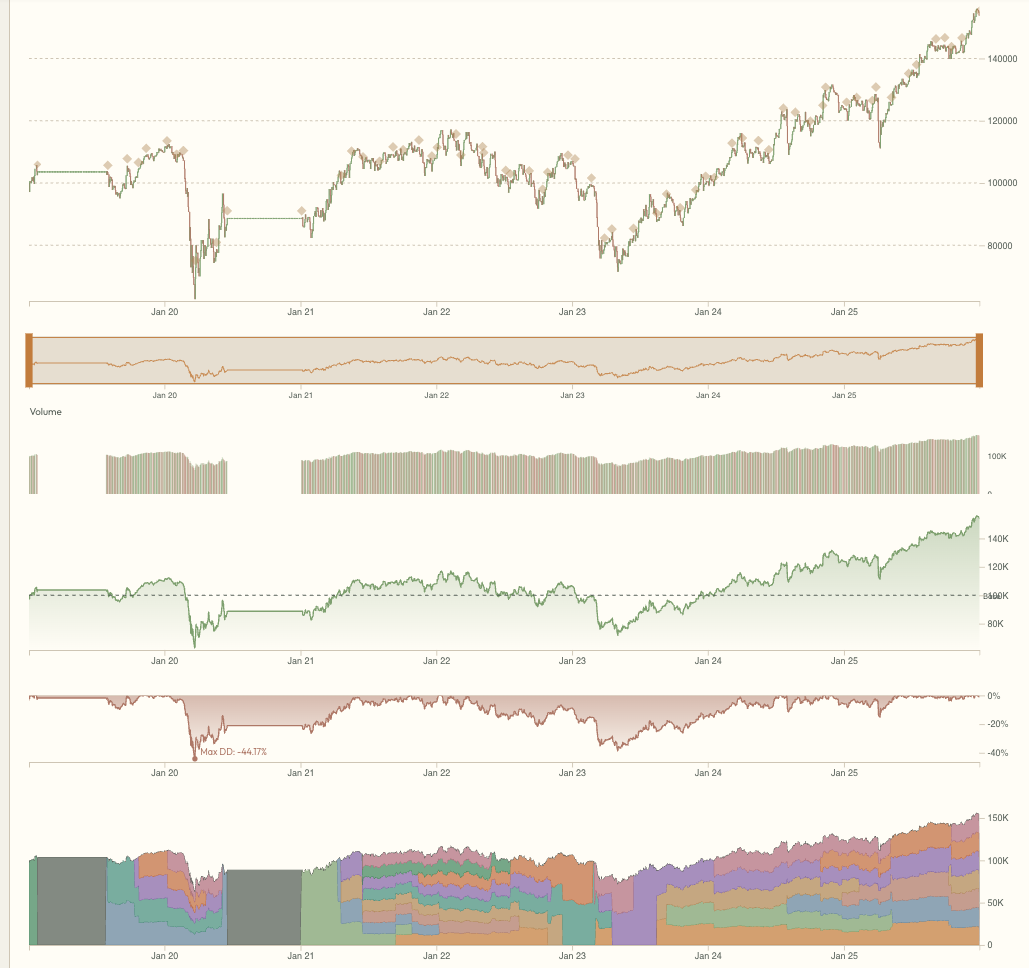
Both backtests ran from Jan 2019 – Dec 2025 with $100,000 initial capital, using the same RSI + trend-filter + 5-day-hold strategy on each portfolio.
| Metric | Portfolio A — Steady Payers | Portfolio B — Value Dippers |
|---|---|---|
| Win rate | 60.3% — most dips bounced | 65.6% — slightly higher hit rate |
| CAGR | 8.72% (Jan 2019–Dec 2025) | 6.35% — meaningfully lower |
| Max drawdown | −41.4% — sharp but recovered | −44.2% — slightly deeper |
| Sharpe ratio | 0.32 — better return per unit of risk | 0.21 — noticeably worse |
| Profit factor | 1.94 — wins clearly exceed losses in size | 1.62 — narrower margin |
| Avg holding | 189 days — patient exits | 176 days — slightly shorter |
| Final value | $179K from $100K initial | $154K from $100K initial |
Here's the part that surprises most people: Portfolio B had a higher win rate — 65.6% vs 60.3% — and still ended with meaningfully lower returns. More of its trades made money, but the losers were bigger.
That's the gap profit factor exposes (1.94 vs 1.62). Portfolio A's average win was a larger multiple of its average loss; Portfolio B's wins came more often but the occasional severe loss ate into them. Cyclical industrials and financials produce more RSI < 30 entries than utilities — but when the macro genuinely turns (rate shocks, credit stress, recession), those names can stay broken longer than a 5-day hold can absorb.
The Sharpe ratio (0.32 vs 0.21) is the fairest single-number comparison: it measures return per unit of risk, capturing both the lower raw return AND the higher volatility of Portfolio B. A 50% gap in Sharpe is substantial — Portfolio A delivered noticeably more return for the same risk budget. This is the opposite of what the win-rate alone suggests, and exactly the kind of insight a backtest gives you that intuition wouldn't.
Key metrics to watch in the results
One number worth calling out: the average holding period was 189 days for Portfolio A and 176 days for Portfolio B — far longer than most people expect from an "RSI strategy". With the trend filter blocking entries during downtrends and the 5-day minimum hold suppressing immediate exits, simulated positions tend to stay open until RSI actually recovers to 65 — and that can take months. The strategy holds more like a medium-term investor than a short-term trader. Don't expect rapid in-and-out trades.
Max drawdown almost always looks worse than expected going in. Portfolio A returned 79% over the test period — but it also passed through a −41% trough along the way. Portfolio B returned less and still hit a −44% drawdown. As the vibe quant intro puts it: the value of a backtest isn't just the final return number. It's pre-experiencing what the ride actually felt like — so you can decide whether you'd trust the strategy through the hard part before any real money is involved.
Things to tweak after your first run
Once there are baseline results on both portfolios, try adjusting one variable at a time. Each change tells you something different about how the strategy actually works:
- RSI buy threshold: Drop to 25 for even fewer signals — only the deepest pullbacks qualify. Raise to 35 for more entries; does the win rate hold up in the backtest, or does it start including too much noise?
- RSI sell threshold: Raise to 70 to let winners run longer. Lower to 55 to take gains faster. Since the exit signal is what drives the average holding time (~6 months in our tests), moving this threshold has a big effect on the character of the strategy.
- Trend filter: Drop the "above 200-day MA" clause and re-run — see how many additional losing trades the filter was quietly blocking. Or tighten it to a 100-day MA for a more responsive trend gate.
- Minimum hold: Set to 0 to allow snap-back exits. Raise to 20 to force longer holds. Each setting tells a different story about what "mean reversion" means on these names.
None of this requires rewriting anything — just adjust the prompt values and run again. The answer is usually in the comparison, not the absolute number.
An honest note on limitations
Mean reversion works in some market conditions and fails in others. During sustained downtrends — when the market is genuinely repricing something lower — buying an oversold RSI signal means catching a falling knife. Portfolio A's stable-sector filters provide some protection; Portfolio B is more exposed. Seeing this play out across a backtest window that includes a real downturn is part of what makes the exercise valuable.
Backtests also can't capture transaction costs, bid-ask spreads, or the simple fact that the future isn't obliged to look like the past. "Past performance doesn't guarantee future results" is a cliché because it's true. What a backtest gives you is a realistic feel for the strategy's rhythm — how often it trades, how bumpy the ride is, whether the underlying logic holds up across different conditions. That's worth knowing before any real money is on the table.
Run the comparison yourself
Build Portfolio A, save it, run the RSI strategy. Then do the same with Portfolio B. The difference between the two results is where the real learning happens.
Start exploring on Porfie →